
UFG News
UFG News
United Fire Group, Inc. Reports First Quarter 2016 Results
Consolidated Financial Results - Highlights:
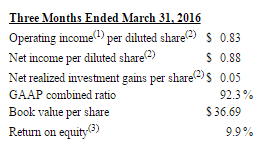
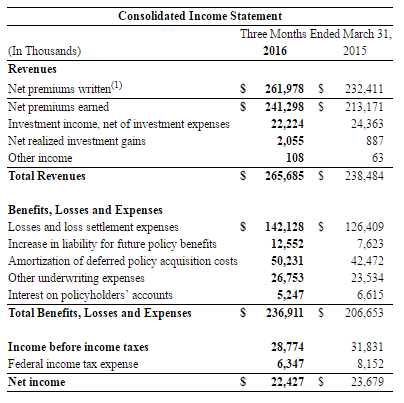
The Company reported consolidated net income, including net realized investment gains and losses, of $22.4 million ($0.88 per diluted share) for the first quarter, compared to consolidated net income of $23.7 million ($0.94 per diluted share) for the same period in 2015.
Strong organic growth and solid business performance
"I'm pleased to report another quarter with good performance," stated Randy Ramlo, President and Chief Executive Officer. "During first quarter 2016, consolidated net premiums earned increased 13.2 percent, which is the result of continued organic growth; total revenues increased 11.4 percent; and our book value increased 5.0 percent to $36.69."
The Company recognized consolidated net realized investment gains of $2.1 million during the first quarter, compared to consolidated net realized investment gains of $0.9 million for the same period in 2015.
Consolidated net investment income was $22.2 million for the first quarter, a decrease of 8.8 percent, as compared to net investment income of $24.4 million for the same period in 2015. The decrease in net investment income for the quarter was primarily driven by the change in value of our investments in limited liability partnerships as compared to the same period in 2015 and the low interest rate environment. The valuation of these investments in limited liability partnerships varies from period to period due to current equity market conditions, specifically related to financial institutions.
____________________________
(1) Operating income (loss) is a commonly used non-GAAP financial measure of net income (loss) excluding realized investment gains and losses and related federal income taxes. Management evaluates this measure and ratios derived from this measure and the Company provides this information to investors because we believe it better represents the normal, ongoing performance of our business. See Supplemental Tables - Financial Highlights for a reconciliation of operating income to net income.
(2) Per share amounts are after tax.
(3) Return on equity is calculated by dividing annualized net income by average year-to-date equity.
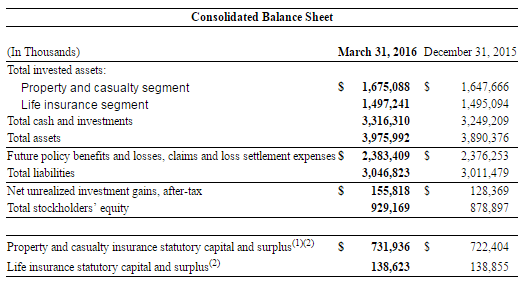
Consolidated net unrealized investment gains, net of tax, totaled $155.8 million as of March 31, 2016, an increase of $27.4 million or 21.4 percent from December 31, 2015. The increase in net unrealized investment gains is primarily the result of a decrease in interest rates, which positively impacted the valuation of our fixed maturity security portfolio during 2016.
Total consolidated assets as of March 31, 2016 were $4.0 billion, which included $3.2 billion of invested assets. The Company's book value per share was $36.69, which is an increase of $1.75 per share or 5.0 percent from December 31, 2015 and is primarily attributed to net income of $22.4 million and an increase in net unrealized investment gains of $27.4 million, net of tax, during the first three months of 2016, partially offset by shareholder dividends of $5.6 million.
The annualized return on equity was 9.9 percent as of March 31, 2016.
P&C Segment
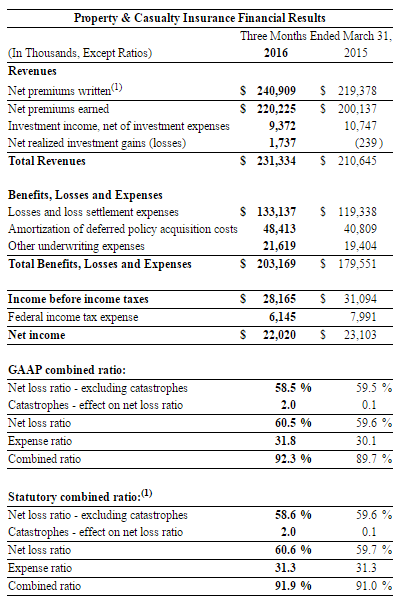
Net income for the property and casualty insurance segment, including net realized investment gains and losses, totaled $22.0 million ($0.86 per diluted share) for the first quarter, compared to net income of $23.1 million ($0.92 per diluted share) in the same period in 2015.
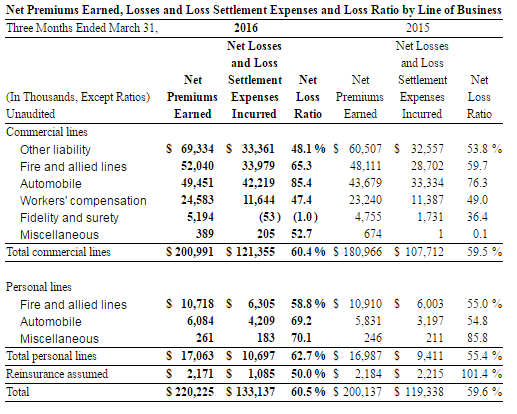
Net premiums earned increased 10.0 percent to $220.2 million in the first quarter, compared to $200.1 million in the same period of 2015 due to organic growth from new business writings and geographical expansion.
Rate increases flat on commercial lines; mid-single digits on personal lines
"Commercial lines renewal pricing was nearly flat, up slightly during first quarter," stated Ramlo. "Premiums written from new business increased compared to the same period in 2015. Premium and policy retention remain strong with both at acceptable levels."
"Personal lines renewal pricing increases during the quarter improved to mid-single digits," stated Ramlo. "The rate increases were primarily in homeowners and personal lines of business."
Catastrophe losses slightly better than expected
Catastrophe losses totaled $4.3 million ($0.11 per diluted share) for the first quarter, compared to $0.2 million ($0.01 per diluted share) for the same period in 2015.
"Catastrophe losses for the first quarter 2016 were slightly less than we would normally expect historically for a first quarter, but higher than the same period in 2015, when there was a lack of catastrophe losses," stated Ramlo. "Catastrophe losses added 2.0 percentage points to the combined ratio and impacted earnings by $0.11 per diluted share in the first quarter 2016."
"Our expectation for catastrophe losses in any given year is six percentage points of the combined ratio," continued Ramlo. "Second and third quarters are more storm- and catastrophe-laden in geographic areas where we conduct much of our business due to spring and summer convective storms and hurricanes."
The property and casualty insurance segment experienced $23.9 million of favorable development in our net reserves for prior accident years during the first quarter, compared to $16.7 million of favorable reserve development in the same period in 2015. Development amounts can vary significantly from quarter-to-quarter and year-to-year depending on a number of factors, including the number of claims settled and the settlement terms. At March 31, 2016, our total reserves were within our actuarial estimates.
The GAAP combined ratio increased by 2.6 percentage points to 92.3 percent for the first quarter, compared to 89.7 percent for the same period in 2015. We attribute the majority of this increase to higher catastrophe losses in the first quarter of 2016 compared to the same period in 2015.
Expense Levels
The expense ratio for the first quarter was 31.8 percentage points, compared to 30.1 percentage points for the first quarter of 2015.
"Our expense ratio was impacted by several non-recurring employee-related expenses and accruals, along with an increase in deferred acquisition cost amortization from continued organic growth, both partially offset by a decrease in post-retirement benefit expenses," stated Ramlo. "We continue to look for efficiencies to manage our expense ratio."
Life Segment
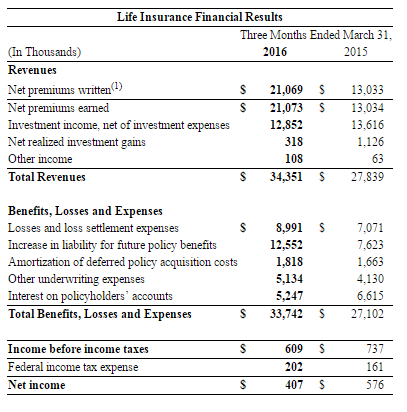
Net income for the life insurance segment totaled $0.4 million ($0.02 per diluted share) for the first quarter, compared to $0.6 million ($0.02 per diluted share) for the first quarter of 2015.
"Sales of single premium whole life policies remained strong this quarter which is the primary driver again of the increase in premiums," stated Ramlo. "We are continuing to execute on our strategy to write more life insurance products, expand geographically, increase profitability on annuity products and focus on reducing expenses in our life segment."
Net premiums earned increased 61.7 percent to $21.1 million for the first quarter, compared to $13.0 million for the first quarter of 2015. The increase was primarily due to an increase in sales of single premium whole life policies.
Net investment income decreased 5.6 percent to $12.9 million for the first quarter, compared to $13.6 million for the first quarter of 2015. The decrease is primarily due to lower invested assets from declining annuity deposits and from the low interest rate environment.
Losses and loss settlement expenses increased $1.9 million for the first quarter, compared to the same period in 2015, due to corresponding increases in death benefits paid. Fluctuations in the timing of death benefits occur from quarter-to-quarter and year-to-year.
The increase in liability for future policy benefits increased during the first quarter by $4.9 million, compared to the same periods in 2015, due to an increase in sales of single premium whole life policies.
Deferred annuity deposits decreased 37.6 percent for the three-month period ended March 31, 2016, compared to the same period of 2015. We continue to execute our strategy to maintain profitability rather than market share, as spreads increased 32 basis points as compared to the same period of 2015.
Net cash outflow related to our annuity business was $19.7 million for the first quarter compared to a net cash outflow of $35.0 million in the same period in 2015. We attribute this to our strategy to maintain profitability on annuity products as previously described.
Capital Management
During the first quarter, we declared and paid a $0.22 per share cash dividend to shareholders of record on March 1, 2016. We have paid a quarterly dividend every quarter since March 1968.
Under our share repurchase program, we may purchase the Company's common stock from time to time on the open market or through privately negotiated transactions. The amount and timing of any purchases will be at management's discretion and will depend upon a number of factors, including the share price, general economic and market conditions, and corporate and regulatory requirements. As of the date of this release, we are authorized by the Board of Directors to purchase an additional 1,528,886 shares of common stock under our share repurchase program, which expires in August 2016. During the first quarter, we did not repurchase any shares.
Earnings Call Access Information
An earnings call will be held at 9:00 a.m. Central Time on May 4, 2016 to allow securities analysts, shareholders and other interested parties the opportunity to hear management discuss the Company's first quarter 2016 results.
Teleconference: Dial-in information for the call is toll-free 1-844-492-3723. The event will be archived and available for digital replay through May 18, 2016. The replay access information is toll-free 1-877-344-7529; conference ID no. 10083117.
Webcast: An audio webcast of the teleconference can be accessed at the Company's investor relations page at
https://ir.ufginsurance.com/event/ or http://services.choruscall.com/links/ufcs160504. The archived audio webcast will be available until May 18, 2016.
Transcript: A transcript of the teleconference will be available on the Company's website soon after the completion of the teleconference.
About United Fire Group, Inc.
Founded in 1946 as United Fire & Casualty Company, United Fire Group, Inc., through its insurance company subsidiaries, is engaged in the business of writing property and casualty insurance and life insurance and selling annuities.
Through our subsidiaries, we are licensed as a property and casualty insurer in 46 states, plus the District of Columbia, and we are represented by approximately 1,200 independent agencies. The United Fire pooled group is rated "A" (Excellent) by A.M. Best Company.
Our subsidiary, United Life Insurance Company, is licensed in 37 states, represented by approximately 1,250 independent life agencies and rated "A-" (Excellent) by A.M. Best Company.
For more information about UFG, visit www.ufginsurance.com.
Contact: Randy Patton, Assistant Vice President of Finance and Investor Relations, 319-286-2537 or IR@unitedfiregroup.com.
Disclosure of Forward-Looking Statements
This release may contain forward-looking statements about our operations, anticipated performance and other similar matters. The Private Securities Litigation Reform Act of 1995 provides a safe harbor under the Securities Act of 1933 and the Securities Exchange Act of 1934 for forward-looking statements. The forward-looking statements are not historical facts and involve risks and uncertainties that could cause actual results to differ from those expected and/or projected. Such forward-looking statements are based on current expectations, estimates, forecasts and projections about our company, the industry in which we operate, and beliefs and assumptions made by management. Words such as "expect(s)," "anticipate(s)," "intends(s)," "plan(s)," "believe(s)" "continue(s)," "seek(s)," "estimate(s)," "goal(s)," "remain optimistic," "target(s)," "forecast(s)," "project(s)," "predict(s)," "should," "could," "may," "will," "might," "hope," "can" and other words and terms of similar meaning or expression in connection with a discussion of future operations, financial performance or financial condition, are intended to identify forward-looking statements. These statements are not guarantees of future performance and involve risks, uncertainties and assumptions that are difficult to predict. Therefore, actual outcomes and results may differ materially from what is expressed in such forward-looking statements. Information concerning factors that could cause actual outcomes and results to differ materially from those expressed in the forward-looking statements is contained in Part I, Item 1A "Risk Factors" of our Annual Report on Form 10-K for the year ended December 31, 2015, filed with the Securities and Exchange Commission ("SEC") on February 26, 2016. The risks identified in our Form 10-K are representative of the risks, uncertainties, and assumptions that could cause actual outcomes and results to differ materially from what is expressed in the forward-looking statements. Readers are cautioned not to place undue reliance on these forward-looking statements, which speak only as of the date of this release or as of the date they are made. Except as required under the federal securities laws and the rules and regulations of the SEC, we do not have any intention or obligation to update publicly any forward-looking statements, whether as a result of new information, future events, or otherwise.
Supplemental Tables

NM = Not meaningful
(1) Operating income is a non-GAAP Financial measure of net income.
(1) Data prepared in accordance with statutory accounting principles, which is a comprehensive basis of accounting other than U.S. GAAP.
(1) Because United Fire & Casualty Company owns United Life Insurance Company, property and casualty insurance statutory capital and surplus includes life insurance statutory capital and surplus and therefore represents our total consolidated statutory capital and surplus.
(2) Data prepared in accordance with statutory accounting principles, which is a comprehensive basis of accounting other than U.S. GAAP.
(1) Data prepared in accordance with statutory accounting principles, which is a comprehensive basis of accounting other than U.S. GAAP.
(1) Net premiums written is a financial measure prepared in accordance with statutory principles, which is a comprehensive basis of accounting other than U.S. GAAP.
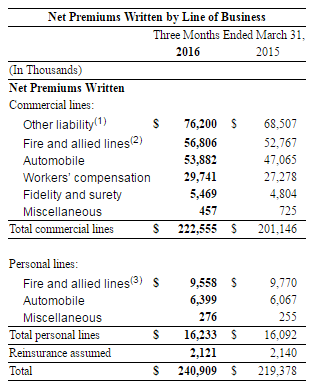
(1) Commercial lines “Other liability” is business insurance covering bodily injury and property damage arising from general business operations, accidents on the insured’s premises and products manufactured or sold.
(2) Commercial lines “Fire and allied lines” includes fire, allied lines, commercial multiple peril and inland marine.
(3) Personal lines “Fire and allied lines” includes fire, allied lines, homeowners and inland marine.
Source: United Fire Group, Inc.
Copyright 2016, © S&P Global Market Intelligence
TERMS AND CONDITIONS OF USE
The investor relations site ("Site") with which this document is associated is maintained by S&P Global Market Intelligence ("S&P") on behalf of the organization featured on the Site (S&P's "Client"). These Terms and Conditions of Use ("Terms of Use") set forth the terms on which you may use the Site, and the information and materials contained therein (the "Contents"). By using the Site, you agree to these Terms of Use. If you do not agree to these Terms of Use, you are not authorized to use the Site or Contents in any manner, and you should immediately discontinue any use of the Site or the Contents.
S&P and/or its Client shall have the right at any time to modify or discontinue any aspect of the Site or any part of the Contents. S&P may also modify these Terms of Use without notice. You agree to monitor these Terms of Use, and to cease all access or use of the Site if you no longer agree to abide by the Terms of Use. Your continued use of the Site shall constitute acceptance of such modification.
S&P and the Client grant to you a limited, personal license to access the Site and to access and download the Contents, but only for your own personal, family and household use. You may not use, reproduce, distribute or display any portion of the Site for any other purpose, including without limit any commercial purpose. You may use the Site and the Contents for lawful purposes only. S&P and Client reserve all rights not expressly granted, including the right to terminate your use of the Site without notice.
The Site contains copyrighted material, trademarks and service marks, and other proprietary information, including but not limited to text, software, and graphics, which materials are owned by S&P and/or its Client. S&P and Client reserve all rights in the Contents. You agree not to reproduce, distribute, sell, broadcast, publish, retransmit, disseminate, circulate or commercially exploit the Site or the Contents without the express written consent of S&P and the Client.
You agree to access the Contents and the Site manually, by request, and not automatically, through the use of a program, or other means. You agree not to take any action, alone or with others, that would interfere with the operation of the Site, to alter the Site in any way, or to impede others' access to and freedom to enjoy and use the Site as made available by S&P and S&P’s Client.
THE SITE AND THE CONTENTS ARE PROVIDED ON AN "AS IS" BASIS. S&P, ITS CLIENT, AND ANY OTHER PROVIDERS OF THE INFORMATION EXPRESSLY DISCLAIM ALL WARRANTIES OF ANY KIND, EXPRESS OR IMPLIED, INCLUDING WITHOUT LIMITATION ANY WARRANTY OF ACCURACY, MERCHANTABILITY, FITNESS FOR A PARTICULAR PURPOSE, OR NON-INFRINGEMENT.
NEITHER, S&P, THE CLIENT NOR EITHER OF THEIR AFFILIATES, SHAREHOLDERS, OFFICERS, EMPLOYEES, AGENTS OR REPRESENTATIVES SHALL BE LIABLE FOR ANY INDIRECT, INCIDENTAL, EXEMPLARY , PUNITIVE SPECIAL OR CONSEQUENTIAL DAMAGES ARISING OUT OF OR RELATING TO THE SITE, THE USE OF OR INABILITY TO USE THE SITE, OR THE CONTENTS, EVEN IF SUCH PARTY HAS BEEN ADVISED OF THE POSSIBILITY OF SUCH DAMAGES. IN PARTICULAR, S&P WILL NOT BE LIABLE FOR ANY LOSS OR DAMAGE CAUSED BY YOUR RELIANCE ON INFORMATION OBTAINED THROUGH THE SITE.
It is your responsibility to evaluate the accuracy, completeness or usefulness of any of the Contents available on the Site. Please seek the advice of professionals regarding the evaluation of any of the information on the Site.
The Site does not represent an offer or solicitation with respect to the purchase or sale of any security.
These Terms of Use are the entire agreement between the parties with respect to its subject matter, and it can be amended only via written agreement by S&P. These terms and conditions shall be governed by the law of New York, without regard to principals of conflicts or choice of laws.
